Road traffic and trips
The development of road networks from the 1950s onwards responded to the growing need for travel and reduced journey times. Until 1972, this was accompanied by an increase in the number of road accidents, albeit at a slower rate than the increase in traffic. To curb this rise in accidents, road safety policies were gradually implemented, including a section dedicated to infrastructure.
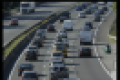
Road traffic is an important indicator for understanding and analysing the risk of accidents. Traffic by motor vehicle category allows for a comparison of exposure according to mode of transport.
After a sharp increase in 2022 (+8.3%), followed by a decline in 2023 (-1.6%), traffic rose slightly again in 2024, reaching 607.9 billion vehicle-kilometres (+0.2%). This level remains below that of 2019, but is still up over 10 years (+1.5%). Over the same period, the number of registered vehicles (excluding two-wheeled motor vehicles) increased by 9.1%.
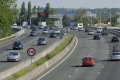
The kilometres travelled by passenger vehicles represent 78% of the total number of conventional vehicles (passenger vehicles, commercial vehicles, heavy vehicles and two-wheeled motor vehicles). The kilometres travelled by commercial vehicles represent 14%. Heavy vehicles account for 7% of road traffic (including 2% for foreign heavy vehicles) for less than 2% of the fleet (excluding two-wheeled motor vehicles).
Traffic has continued to increase over the long term, with the sole notable exception of the lockdown period during the health crisis. Despite this continuous and sustained increase, the mortality rate per billion vehicle-kilometres has continued to decline over the same period.
In terms of travel, the average ‘distance budget’ for a person on an average weekday in local mobility (trips made within 80 km of home) is 26.5 km (Employment Mobility Survey – EMP – 2019). Men often travel greater distances than women, both in general and according to mode of transport or age group. However, the use of public transport and walking is similar among men and women. Finally, although cycling is more common among men, it remains low overall.
These factors make it possible to assess the risk to users according to their mode of transport. For example, the excess risk for users of two-wheeled motor vehicles is particularly high: the risk of being killed for a motorcyclist or moped rider (driver or passenger) relative to travel time is 29 times higher than for motorists.

Articles list 4 élément(s)