Parc Auto is the annual reference study for more than 30 years on the French household car fleet conducted by Kantar TNS between February and April 2021 through two questionnaires with 10,000 households representative of the French population, which provides information on both the motorization rate of the vehicle fleet and their characteristics, equipment level, usage behaviour and user profile.
Parc Auto is the annual benchmark study on the French household car fleet Kantar TNS (formerly TNS Sofres) which includes two questionnaires ("Your household and the car" and "You and the car") with 10,000 households representing the French population.
Motorization rate and fleet size
The number of vehicles available to households is estimated at 36.09 million on 1 January 2020. It is continuing the growth that began four years ago, fuelled in particular by an increase in the multi-car rate (proportion of households with at least two cars) of 6 points in five years, while the rate of households owning a car has fallen by 4 points.
The rate of car ownership, estimated at 86,2%, is still on the rise (+0.2 points in 2019) after a decline observed between 2011 and 2015. Car ownership peaks among heads of household aged between 55 and 64 and among the most affluent households.
The smaller the agglomeration, the higher the rate of car ownership and multiple car ownership. Multi-motorisation has increased over the past 10 years in all areas but has remained stable since 2016.
For non-motorised households, the reasons given are essentially that they do not have a driving licence and that they have no real need.
Vehicle characteristics
For the first time in 10 years, the average age of the fleet has decreased, while remaining stable overall since 2015. With the success of the conversion premium, the weight of the fleet of vehicles aged between 5 and 10 years has fallen by 3 points since 2017, while that of vehicles aged over 10 years has remained stable (33%).
The share of new vehicles remains stable. Second-hand vehicles (20.9 million) account for 58% of the fleet and 64% of cars purchased in 2019. The average age of petrol vehicles continues to fall and is now lower than that of diesel vehicles (8.6 years versus 9.2 years).
Among the range levels, the share of the 4x4 SUV (Sport Utility Vehicle) segment continues to increase in 2019 (+2 points). Its weight in the fleet has increased from 2% to 15% in 9 years. This increase has led to a significant drop in the weight of the M2 (medium saloon) and H (large saloon) segments.
Despite a drop of 2 points compared to 2018, French brands still account for a large majority of the French car fleet, with a weight of 62% However, Renault has seen a 5-point drop since 2012 (22% of the fleet in 2019).
Use behaviours
Average annual mileage per vehicle declines in 2020 due to the Covid-19 pandemic. Vehicles less than 10 years old travel more than 2,000 km per year than those older than 10 years.
The share of vehicles being used daily remains at 35%, compared to 42% before the pandemic. Most households make a single daily round trip (34%) to work and school. These trips average 34 km per trip, or 36 minutes in duration.
Vehicles of main users (MU) aged 25 to 54 account for 61 percent of miles traveled, down from 2010 (-5 points). This decrease is mostly attributed to the 65 and over age group, which went from 14 to 18 percent over the same period. MU vehicles under 25 years old account for 4 percent of miles traveled.
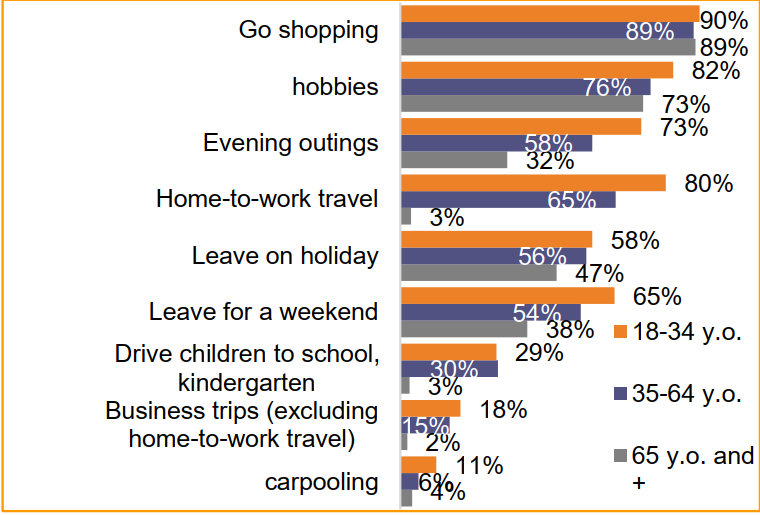
The year 2020 does not show big differences in the reasons for vehicle use compared to previous years. The main reasons are still shopping (89%) and leisure (76%).
Road users profiles
The share of female primary users (PUs) of vehicles is 44% (knowing that women make up 52% of the population 18 years and older); the miles traveled by these vehicles are only 42% of the total. The share of female PUs is up 2.3 points since 2010.
More than a quarter of the primary users are 65 years or older, while vehicles in this category account for only 18% of the miles driven.
39% of vehicles are used by occasional drivers, but nearly 3 out of 4 achieve less than a quarter of the total vehicle mileage.
Young people aged 18 to 24 represent 4% of primary users (compared to 10% of the population). As the population ages, those 65 and older are the most represented among primary users (25%). The proportion of licensed drivers tends to increase among those aged 75 and over (90% in 2019 compared to 81% in 2012) but remains stable for other age groups. The 18-21 age group has the lowest proportion of licensed drivers (65%) while the 75+ age group has the lowest proportion of licensed drivers (80%).
Among 18-24 year olds, 73% have a driver's license but only 52% drive regularly. The oldest age groups have a significant rate of license holders not driving, rising to 18% among those 75 years and older.