ONISR analyses the impact on road safety in 2021 of raising the speed limit to 90 km/h in certain departments. Since 2020, the French law on the organisation of mobility (LOM) has authorised local authorities to raise the speed limit to 90 km/h on two-way roads without central reserve outside built-up areas.
During the Interministerial Road Safety Committee of January 9, 2018, 18 measures were decided, including measure no. 5, the purpose of which was to reduce the speed limit outside built-up areas and off motorways. After an experiment carried out between 2015 and 2017, and according to the terms of decree no. 2018-487 of June 15, 2018 relating to the speed limit (SL) of vehicles, which implements this measure, on two-way roads without a central separator, the speed limit was lowered from 90 to 80 km/h on July 1, 2018.
On December 23, 2019, the mobility orientation law, known as the LOM law, was promulgated, in which article 15 bis B introduces the possibility of returning to 90 km/h on two-way roads outside built-up areas. "for sections of roads outside the built-up area falling under [the] jurisdiction [of] the president of the county council or, when he is the authority holding the power of traffic police, the mayor or the president of the public establishment of inter-municipal cooperation] and not comprising at least two lanes assigned to the same direction of traffic”. This decision must be taken after consulting the Departmental Road Safety Commission (CDSR), based on an accident study covering each of the sections of road concerned.
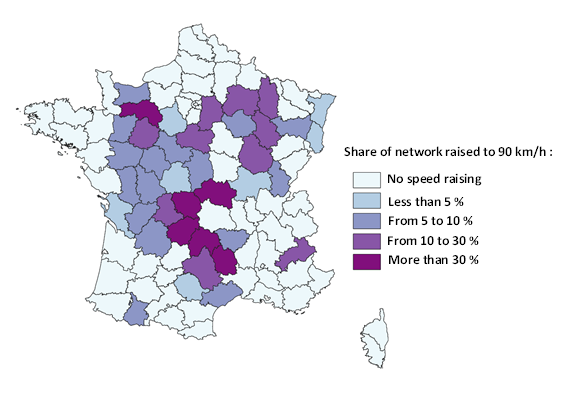
Over the first two years, 2020 and 2021, 39 departments have decided to raise the speed limit to 90 km/h on all or part of their network.
5 departments have raised the speed limit on more than 80 % of their network ; 26 on less than 15 %.
The departments that have chosen to raise the speed limit to 90 km/h are mainly rural and sparsely populated or mountainous. The proportion of fatalities outside built-up areas (on non-motorway roads) is higher than the national average.
However, in 2018, ONISR conducted a study on fatalities on two-way roads outside built-up areas over the period 2012-2016. The study confirms that on average 10 % of the main roads (departmental and national roads) concentrate 41 % of the mortality on this network, if we consider 20 % of the same network, we reach 60 % of the mortality on the national roads and departmental roads, i.e. 55 % of mortality on two-way roads outside built-up areas. In particular, in highly density or even mountainous departments, the main roads represent a small proportion of the road length but they are the only ones where it is possible to reach the speed limit; thus, the changes of speed limit on this network have a major impact on departments road safety performance.
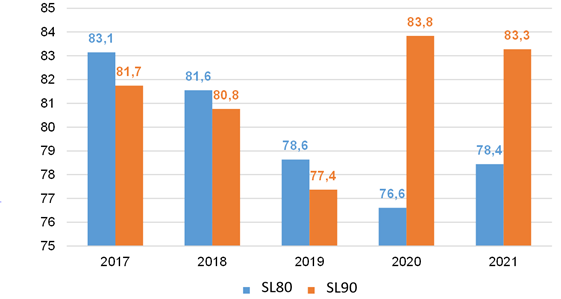
The recorded speeds on the roads where the speed limit was raised to 90 km/h from 2020 are higher in 2020 and 2021 than in 2017, before the implementation of a national 80 km/h speed limit.
On the graph below :
- the SL80 represents a sample of observations where the speed limit was 90 km/h up to the 1st July 2018, then 80 km/h ever since
- the SL90 represents a sample of observations where the speed limit was 90 km/h up to the 1st July 2018, then 80 km/h, and back to 90 km/h from 2020 onwards.
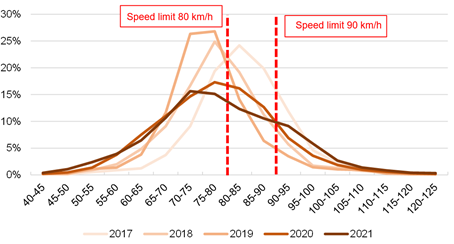
The data used for the study on recorded free-flow speeds are taken from the ONISR speed observatory and relate to passenger vehicles. The curves below concern observation points in departments that have been raised to 90 km/h in 2020 or 2021, i.e. they are present on roads that have remained at 80 km/h or have been raised to 90 km/h, in order to have sufficient numbers to carry out the speed distribution.
Between 2017 and 2019, the distribution curve of the recorded speeds on the panel of the 90total group experienced a flattening and presented a peak between 70 and 80 km/h clearly perceptible in 2019 in particular.
In 2020, this curve flattened, highlighting the different speed limit of this network. In 2021, the distribution of speeds is no longer normal and almost reveals 2 "bumps": the first between 70 and 75 km/h and the second between 90 and 95 km/h. This distribution highlights significant differences in behaviour between users according to the speed limit.
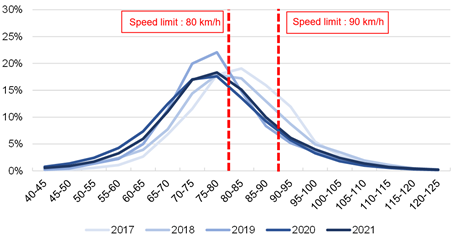
In comparison, the evolution of the speed distributions of passenger vehicles in the departments remaining at 80 km/h shows a stable distribution over 2020 and 2021.
How can we assess the impact on fatalities in 2021, a year still affected by pandemic management measures?
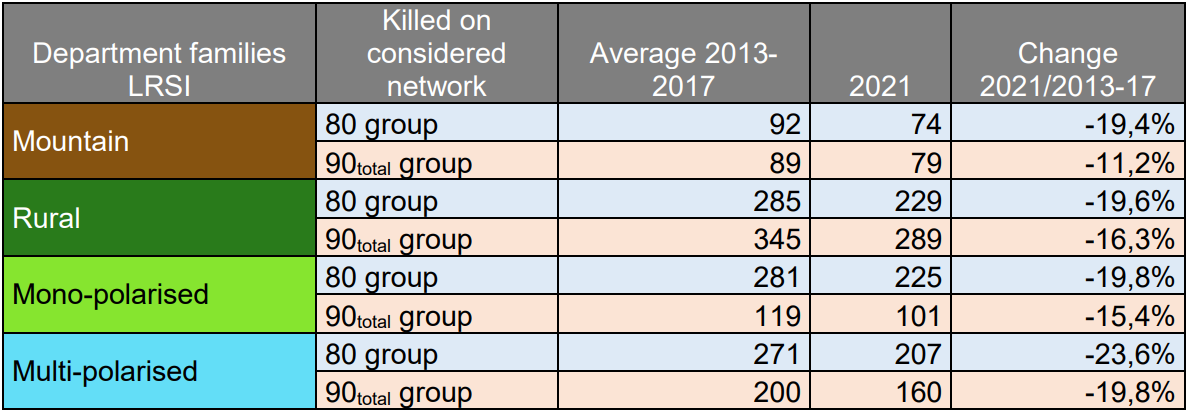
An initial comparison of fatalities in 2021 between the group of departments remaining at 80 km/h ('group 80') and the group of departments having increased the speed limit on all or part of their network in 2020 or 2021 ('group 90') indicates a greater drop in the number of fatalities on the 'group 80' in 2021 compared to the period 2013-2017 (before the implementation of the 80 km/h speed limit). This result is not only true overall, but also within each family of departments (according to the Cerema classification: 'rural, sparsely populated', 'mountain', 'mono-polarised' and 'multipolarised' departments).
Estimating the loss of life due to the increase to 90 km/h
A more detailed study on the evolution of the number of fatalities was carried out by taking into account the precise months of implementation of the 90 km/h speed limit in the departements. It concluded that :
- Raising the speed limit to 90 km/h in 39 departments will have cost 74 lives in 2021, according to an estimate based on the month in which the decision was implemented. This corresponds to an increase in the number of fatalities of +13.1%.
- In a 'normal' year, raising the speed limit to 90 km/h in 39 departments could result in an additional 89 deaths.
- A 13.1% increase in deaths recorded in 2019 on all non-motorway roads outside built-up areas in mainland France would correspond to 254 additional deaths.