Behaviour observations in traffic in 2021 show a stability in the use of seatbelts in the back of cars and the use of safety helmets among cyclists, a study published by ONISR in September 2022. This report is now available in English.
Behaviors are observed by a specialized contractor on behalf of the ONISR. They survey the wearing of seatbelts, the wearing of safety helmets for powered two-wheelers and cyclists, the use of telephones while driving or by pedestrians, and the level of vehicle occupancy. The observations were suspended between 2013 and 2015.
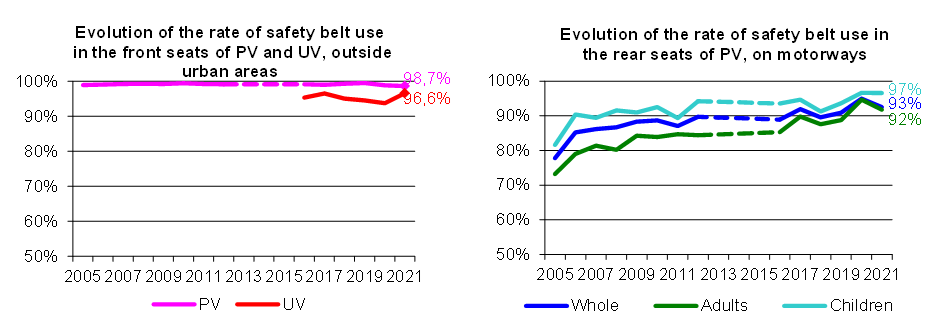
In 2021, an increase in rear seat belt use
The rate of seat belt use by passenger car occupants remains stable in the front seat compared with the previous year, with a very marginal rate of non-use of seat belts, of between 1 and 2%. The front seat belt is worn less in large urban areas. At the rear of VTs, there was a significant increase in the rate of belt use on motorways (95%, +4 points) and a return to the 2018 level in large conurbations (90%) after the sharp fall in 2019. The comparison between working days and weekends does not show any significant difference.
For users of light goods vehicles, the rate of seatbelt use observed in the front is 94% outside built-up areas and 96% in large urban areas, where it has risen significantly by 4 points compared to 2019 and by 10 points compared to 2016.
Safety helmets are almost always worn by motorcyclists in mainland France, and are still on the increase among cyclists
Although the figures are still very high, the rate of helmet use by powered two-wheeler users is at its lowest level in 10 years outside urban areas and in large urban areas (96.5% and 97.9% respectively).
Safety helmet use continues to rise among cyclists. The rate is now 32% in 2021, up from 29% in 2019 and 21% in 2016. It remains more worn on weekends (36%) than on workdays (27%).
Phone use on the rise among LGV users for all drivers, regardless of mode of travel
Observations of distractor use while driving show an increase in distractor use for all drivers, regardless of mode of travel, from +0.9 points among passenger cars drivers (4.2%) to +5.0 points among LGV drivers (13.4%). These rates are higher on weekdays than at weekends and higher in large urban areas than outside urban areas. For cyclists in built-up areas, the rate explodes in 2021 (14.2%, +7.8 points), notably linked to a high rate of wearing earphones corresponding to 10.1% of cyclists observed. Pedestrian use of distractors at crosswalks increases from 2020. 28% use it at some point during the crossing (+7.5 points), including 23 points (+6.8 points) with the distractor in hand, particularly among the youngest age groups.
Fuller vehicles on motorways and in built-up areas
The observations also count vehicle occupants, making it possible to estimate an average occupancy rate. For passenger vehicles, it is in the order of 1.35 to 1.55 depending on the road network (higher on freeways). It is higher on weekends than on working days, whatever the network considered.