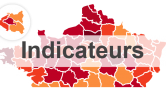
Local performance indicators
How to compare structurally different territories? The analysis of the evolution of road safety in a territory, and more particularly its mortality, is often delicate because the reduced number of accidents is subject to statistical uncertainties. Thus, accidents in the French departments and territories can vary significantly from one year to the next. The analyses most often cover periods of 3 to 5 years, either by looking at the number of victims or, in order to draw comparisons between territories, by using ratios. The most commonly used indicator is the ratio of the number of fatalities per population.
Annual road safety reports
The collection of annual reports in French dates back to 1954. The French road safety observatory (ONISR) took over from Setra in 1991,while the observatory officially became inter-ministerial in 1993 and was placed close to the inter-ministerial Director for road safety. Today, the observatory is responsible for collecting, formatting, interpreting and disseminating national and international statistical data relating to road safety.
Each year, the publication of the road safety report is a highlight of its activity. The assessment is aimed at a public of specialists and non-specialists alike. The purpose of the annual report is to present road safety performance, to make people understand accidents components, in particular through thematic and transversal analyses. It is also a question of highlighting the major challenges of road safety. Since 2017, the focus on Overseas France has been enhanced and new landmark studies have been added.

Annual reports on offences and demerit points
Since 2001, an annual report has been published on the offences recorded by the national police and gendarmerie forces, excluding municipal police activities, and their impact on driving licenses points.
The data come from the General Directorate of the Gendarmerie (DGGN), the Central Directorate of Republican Security Companies (DCCRS), the Central Directorate of Public Security (DCSP), Paris national Police (PP) and finally the National Agency for Automated Processing of Offences (ANTAI).
The annual reports used to be carried out by the Sub-Directorate for Traffic and Road Safety (SDCSR), in the Directorate for the Modernisation of Territorial Action (DMAT). Since 2014, ONISR has taken over this activity.
Road safety monitoring
Quick feedback reports are regularly transmitted by the services of the Ministry of the Interior, limited to the number of injury accidents, injured people and fatalities. Thus it makes it possible to publish a monthly dashboard based on calculated estimates, as soon as the following month. The monthly dashboard presents various comparisons (from the month to the same month of the previous year, from the first N months of the year to the same N months of the previous year) as well as a trend monitoring based on 12 gliding months. Additional monitoring of victims by mode of travel and age, and by region, is included in the monthly dashboard every quarter. Since 2019, the quick reporting have been supported by the first accident records sent on a daily basis through the information systems. This has made it possible from 2021 onwards to present monthly estimates for the main indicators in the barometer : by type of users, age groups, or road network.

Monthly dashboard
The quick reporting transmitted by the services of the Ministry of the Interior on provisional numbers for injury accidents, fatalities, and injured people makes it possible to give a provisional estimate of the accidentality results in France for a given month from the first days of the following month.
These estimates, extrapolated from the provisional figures, are presented in a monthly dashboard offering various comparisons (from the month to the same month of the previous year, from the first n months of the year to the same n months of the previous year) as well as trend monitoring based on 12 sliding months.
Since January 2021, the barometer includes more monthly indicators (mortality by mode of travel, road network, or for certain sensitive age groups), estimated thanks to the new TRAxy information system, and allows more detailed comments for the current month, the trend since the beginning of the year and over 12 gliding months. Furthermore, in order to identify the particularities linked to the health crisis, at the beginning of a new decade, the 2019 indicators are presented in comparison - the year 2019 can be considered as a representative year of the results achieved before the health crisis. Several methodological inserts have been added.

Articles list 120 élément(s)